syri
Synteny and Rearrangement Identifier
Plotting genomic structure using plotsr
The output of SyRI can be used with plotsr to generate a graphical represtation of genomic structure using the following command:
python /path/to/plotsr syri.out /path/to/refgenome /path/to/qrygenome
Usage and available parameters:
usage: Arguments for plotting SRs predicted by SyRI [-h] [-s S] [-R] [-f F]
                                                    [-H H] [-W W]
                                                    [-o {pdf,png,svg}] [-d D]
                                                    [-b {agg,cairo,pdf,pgf,ps,svg,template}]
                                                    reg r q

positional arguments:
  reg                   syri.out file generated by SyRI
  r                     path to reference genome
  q                     path to query genome

optional arguments:
  -h, --help            show this help message and exit
  -s S                  minimum size of a SR to be plotted
  -R                    Create ribbons
  -f F                  font size
  -H H                  height of the plot
  -W W                  width of the plot
  -o {pdf,png,svg}      output file format (pdf, png, svg)
  -d D                  DPI for the final image
  -b {agg,cairo,pdf,pgf,ps,svg,template}
                        Matplotlib backend to use
Example of output plot:
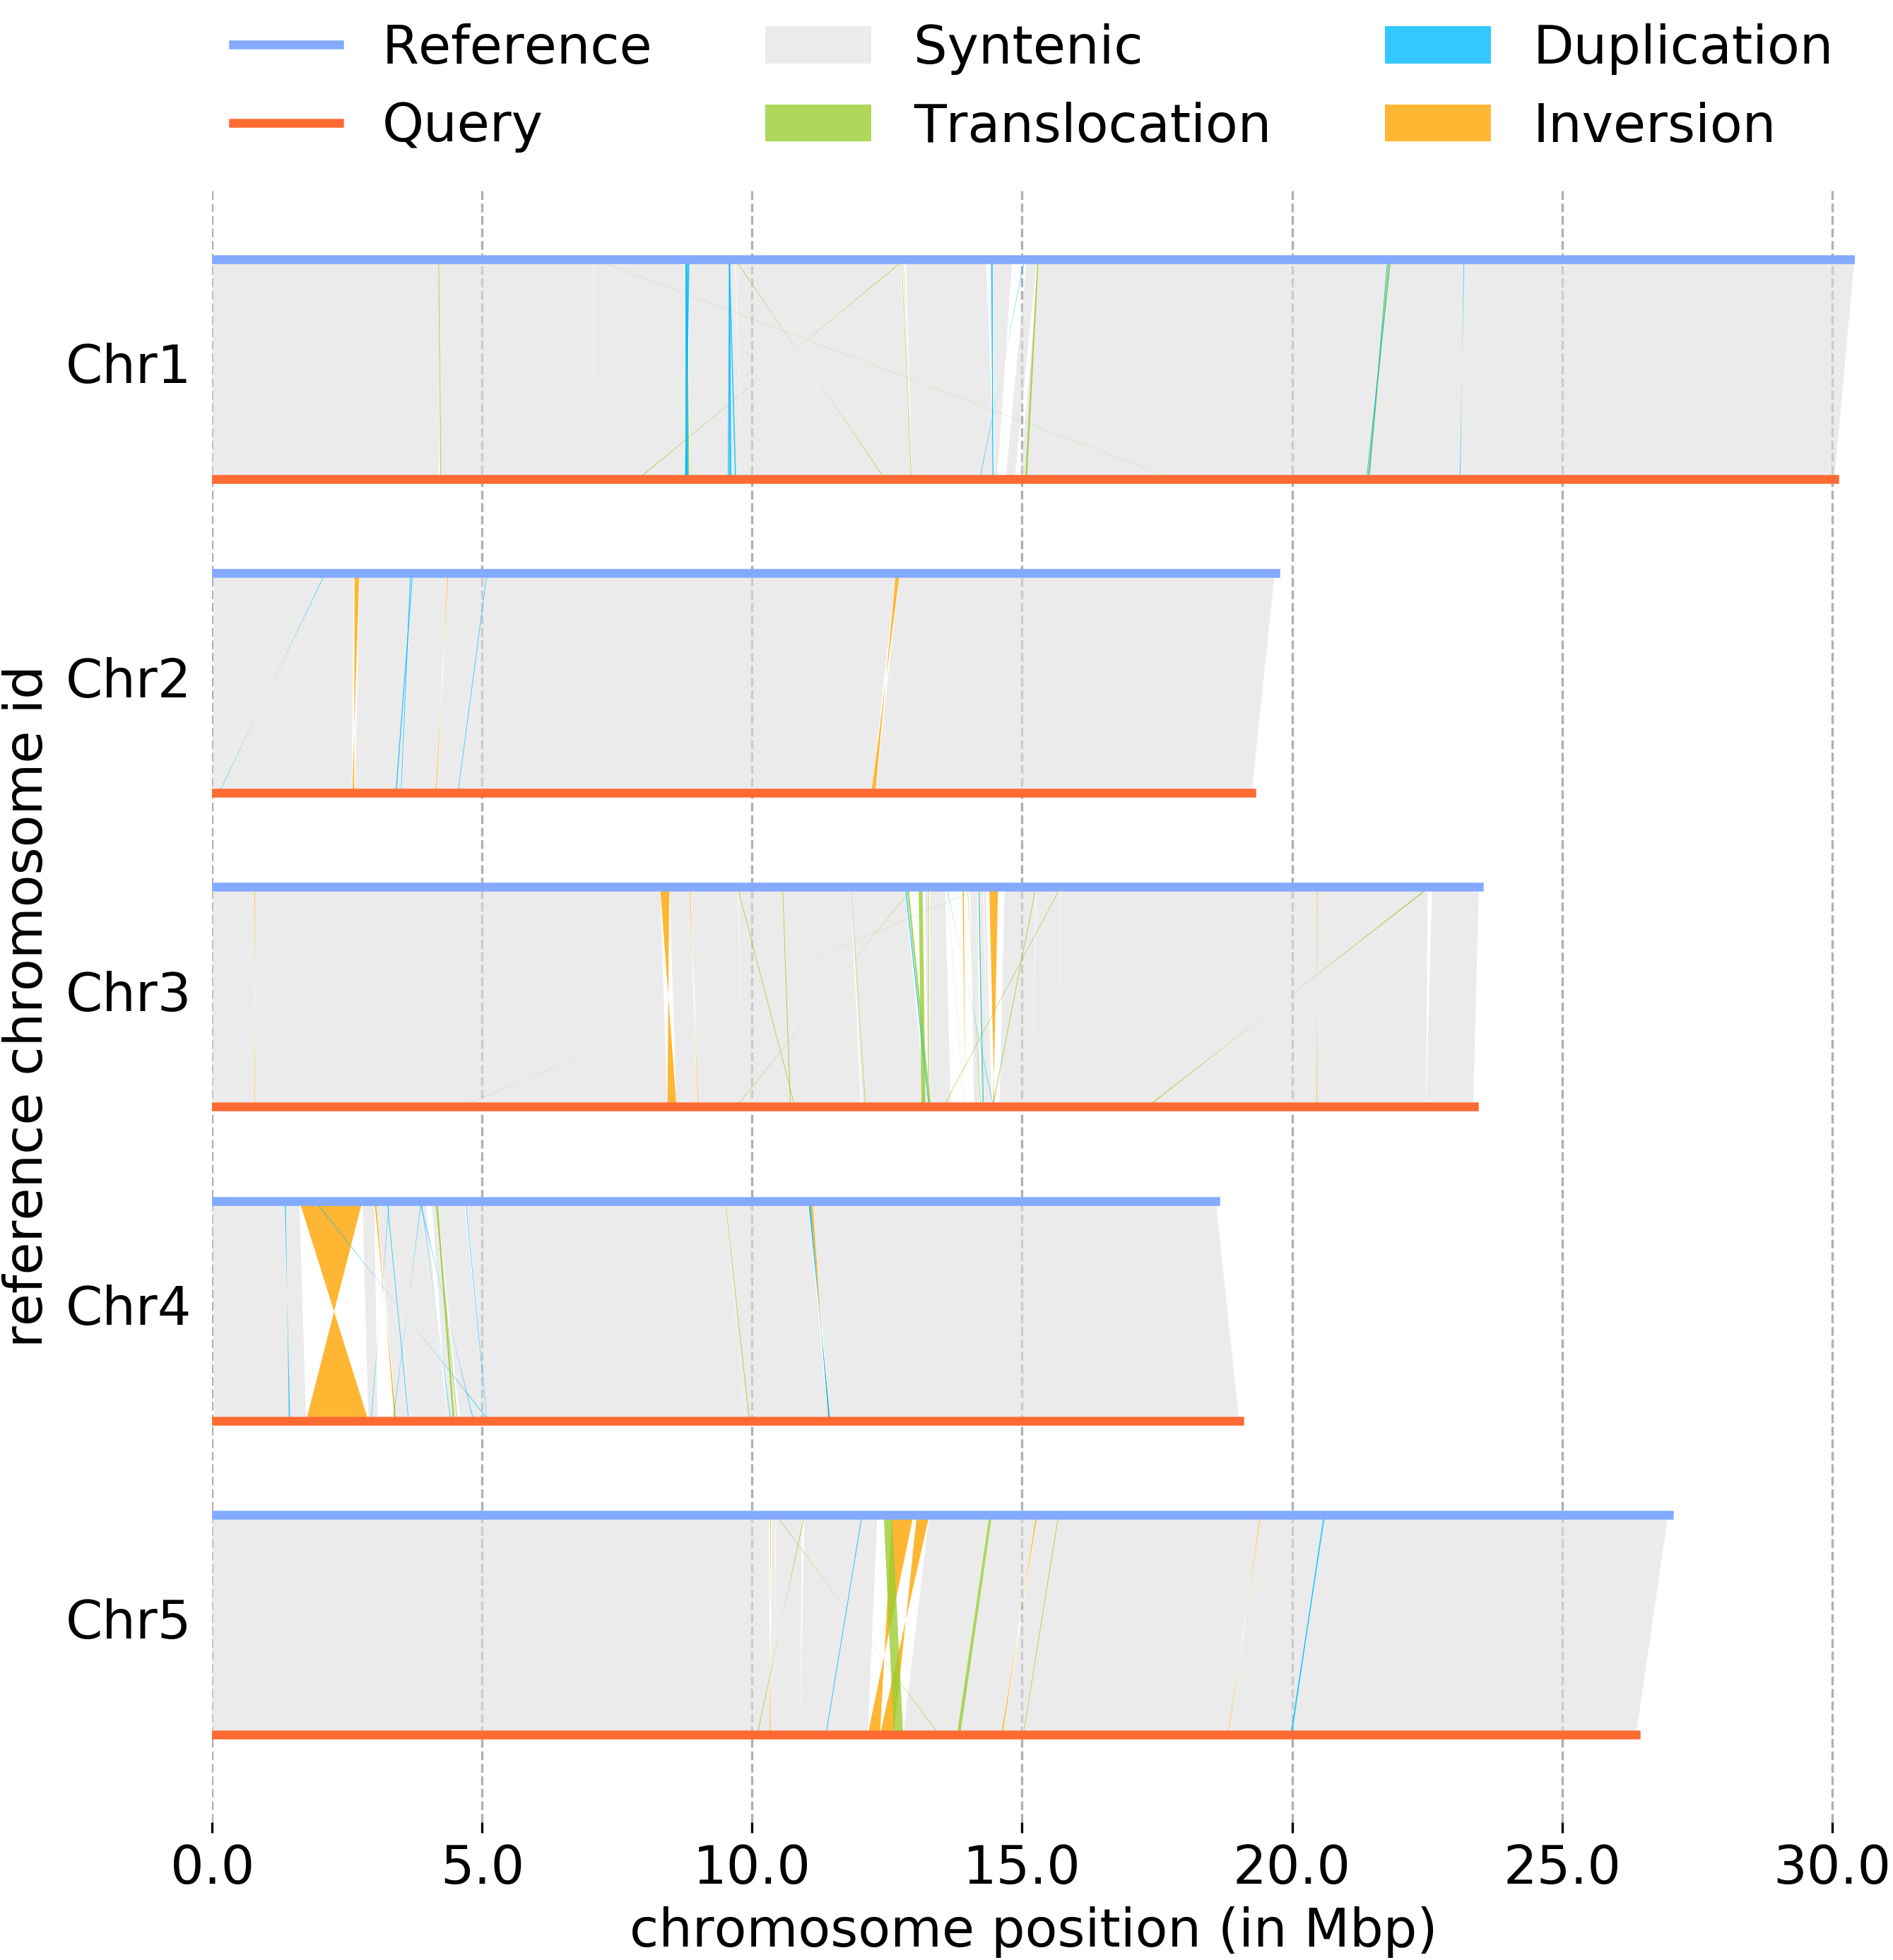
Sample plot generated using plotsr.